
How to Conduct a Martech Stack Audit


A Martech Stack Audit is the best way to find opportunities for consolidation and cost savings within your marketing technology stack, but with out the right process you can waste even more time and effort.
TL;DR: A martech stack audit identifies redundant tools, wasted spend, and consolidation opportunities across your marketing technology. Moving through the right six steps detailed below, does take time and effort but it avoids confusion and ensures accuracy. StackOverlap automates this process in minutes.
What is a martech stack audit?
A marketing technology audit is a structured review of every tool, platform, and system your marketing and sales teams use - what it costs, who owns it, and what it actually does.
The goal is simple: find what's working, what's overlapping, and what's burning budget for no return.
Why most martech stacks have more overlap than you think
The numbers are blunt. The 2026 martech landscape now counts 15,505 solutions - up from 14,106 in 2024, a jump of nearly 1,400 tools in two years, according to chiefmartec.com. More choice means more sprawl.
But the era of relentless expansion may be over. Growth has effectively plateaued at just 0.79% YoY in 2026, down from 27.8% YoY in 2024. Scott Brinker calls this "peak martech" in the State of Martech 2026 report - noting that after 15 years of expansion, the landscape has finally stopped growing in any meaningful sense. Yet underneath that flat headline, the market is churning fiercely: 1,488 new products entered the landscape in 2026 alone, while 1,367 were removed - meaning consolidation and churn are accelerating, not slowing.
And teams still aren't using what they buy. Gartner-tracked utilization dropped from 56% in 2024 to 49% in 2025. Meanwhile, martech spend now accounts for 25.4% of the average marketing budget. That's a big line item for tools that are half-used.
The result? Duplicate capabilities pile up across categories - email, analytics, data enrichment, content - because teams buy tools independently, without a full view of what's already in the stack. Marketing stack consolidation becomes urgent, not optional.
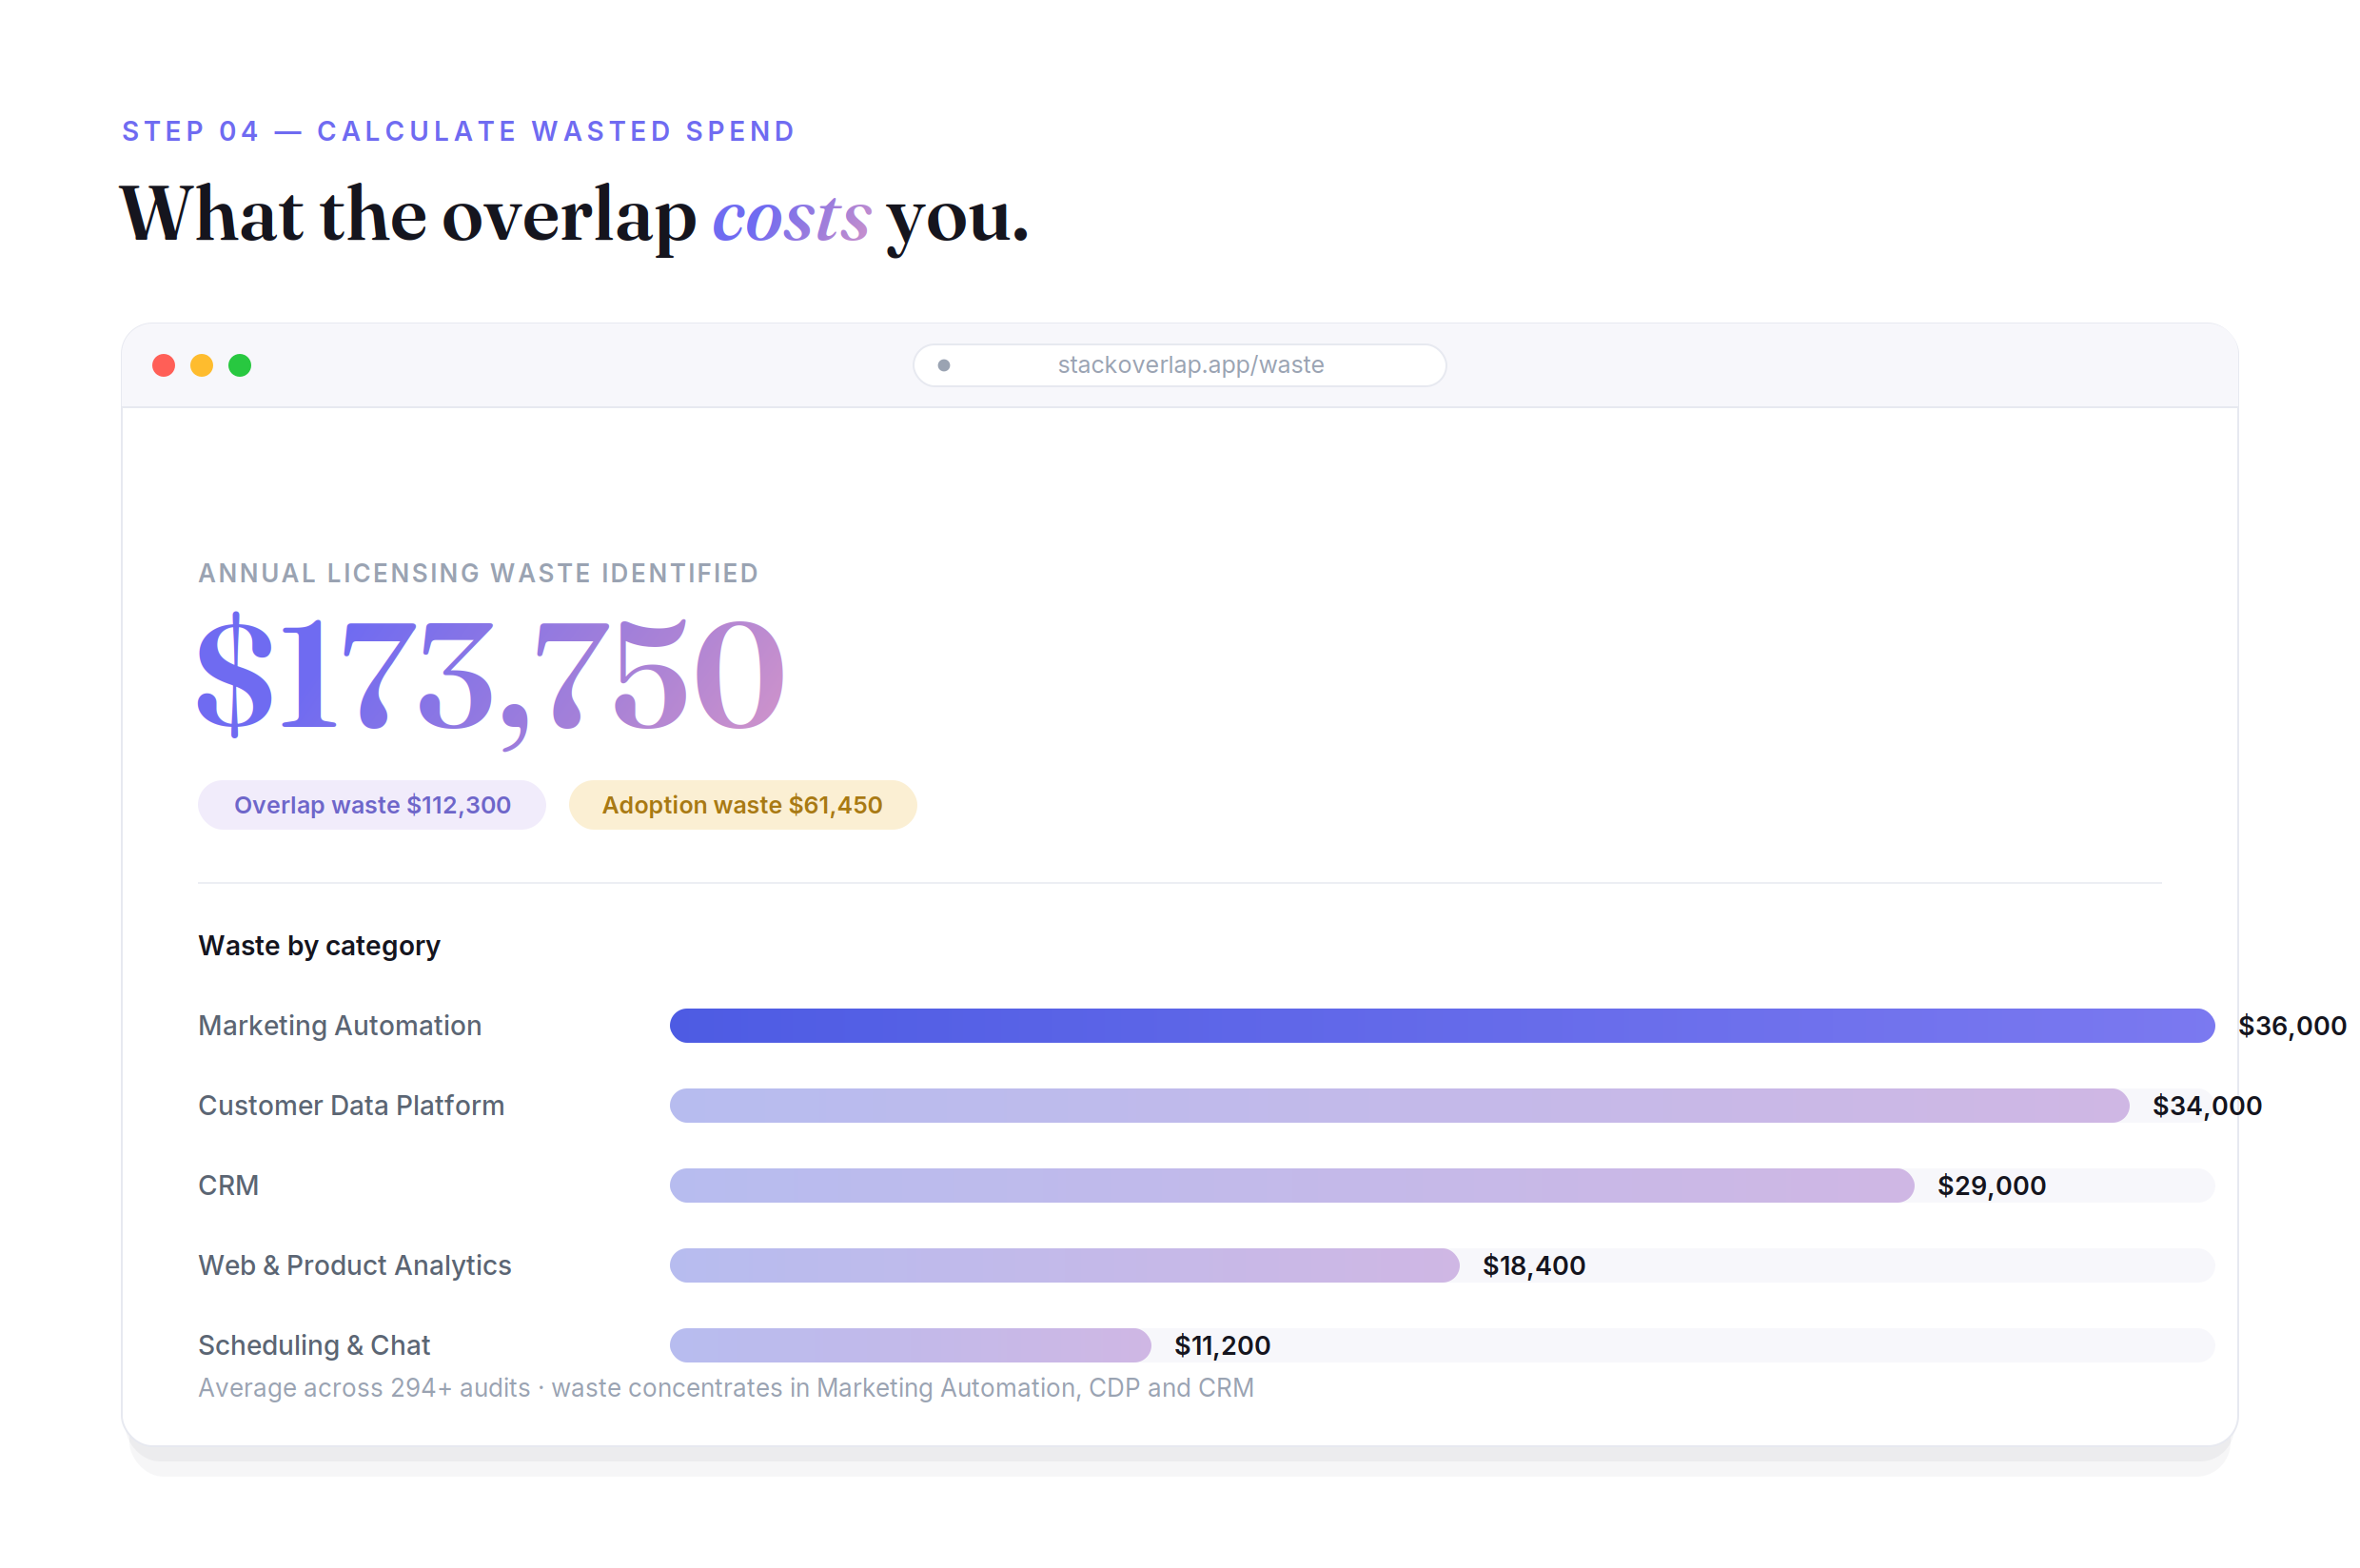
The pattern shows up in real audit data too. Across 550+ audits run through StackOverlap, the average annual licensing waste identified per organisation is $173,750 - adding up to more than $8M in total waste identified to date. The average stack audited contains 10 tools. That's not a rounding error; it's a structural problem with how martech gets bought. View the full breakdown at stackoverlap.app/transparency.

Build your stack, find the overlaps and manage it.
My take - Troy Muir, Founder of StackOverlap

The 15,000-tool landscape isn't a market phenomenon — it's a governance failure. Teams bought tools on credit cards without checking what was already in the stack. When I started analysing stacks through StackOverlap, the most consistent — and most expensive — pattern was overlap in email and analytics. Not because those categories are crowded, but because every major platform now ships a 'good enough' version of the other's core feature. Most stacks are quietly paying for the same capability three or four times over, and nobody's mapped it because each tool was bought by a different team in a different quarter.
What a martech stack audit covers
Tool inventory and ownership
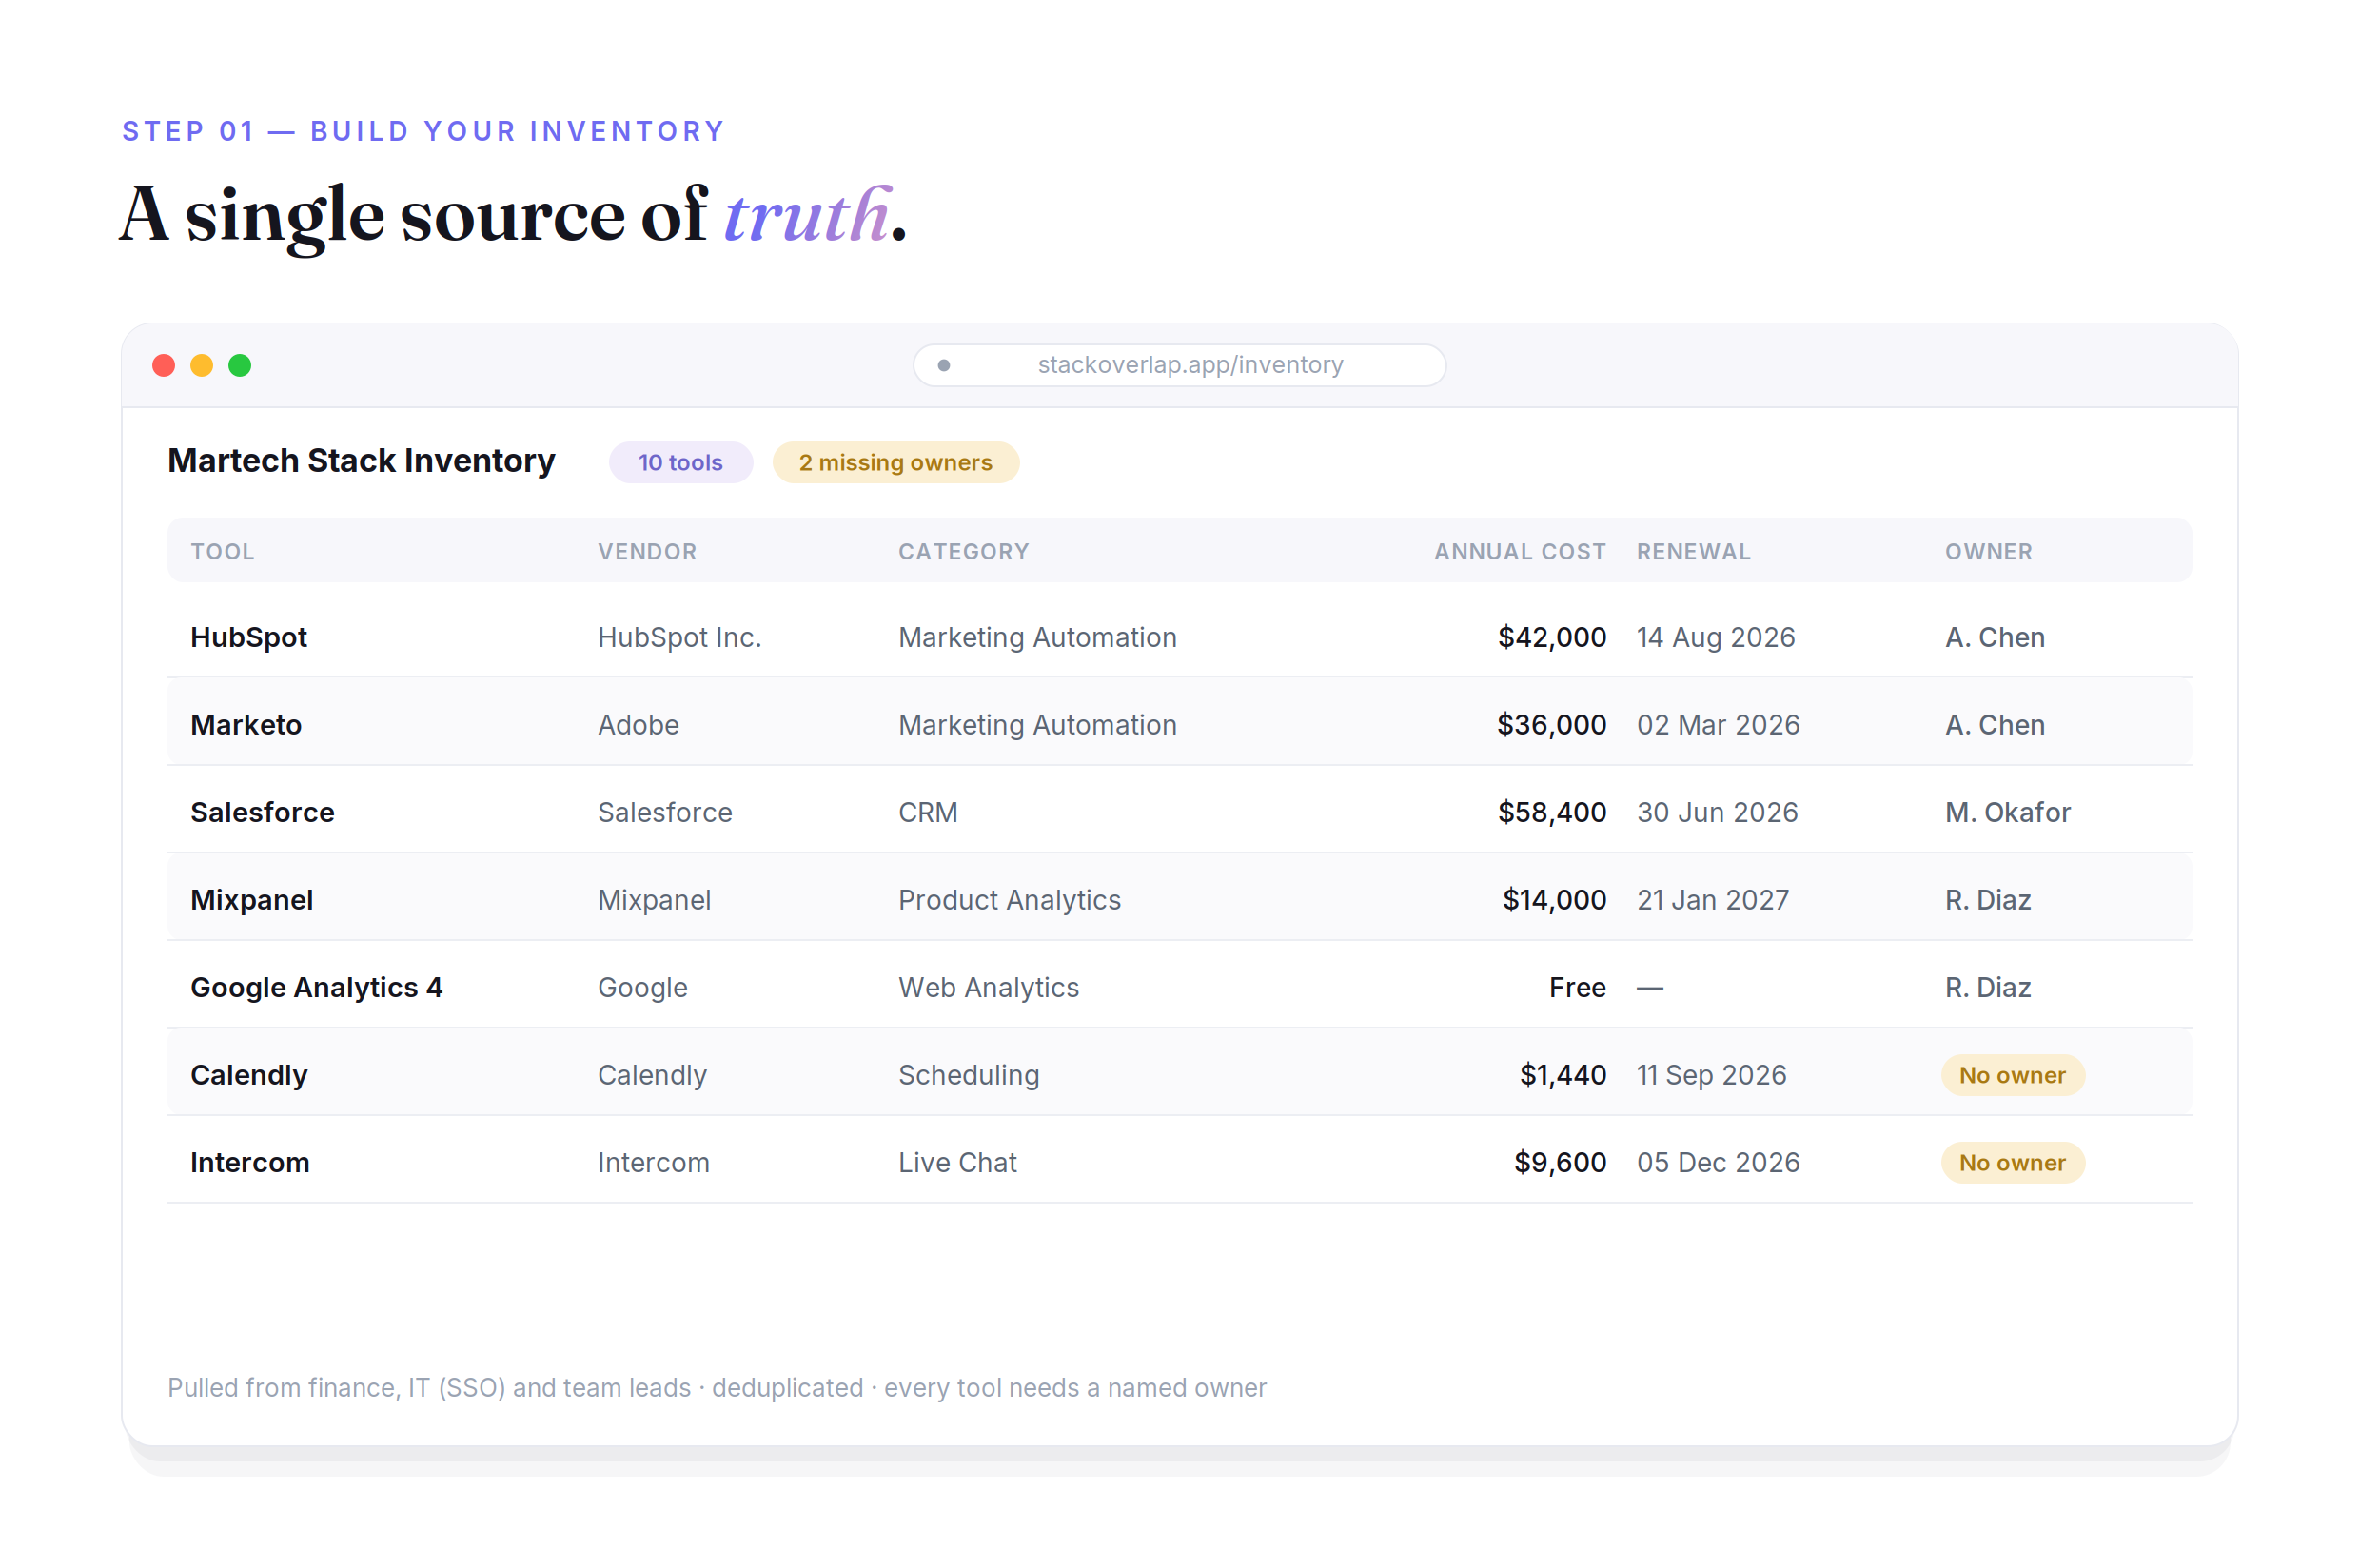
Start with a complete list of every tool in use: name, vendor, cost, renewal date, and the person responsible for it. Without a clear owner, tools drift - nobody cancels them, nobody optimises them.
A solid inventory also flags shadow IT: tools bought by individual teams that never went through procurement.
Overlap and redundancy detection
This is where most audits surface the biggest savings. Martech tool overlap happens when two or more tools share the same capability - think two email platforms, three analytics tools, or four project management apps running in parallel.
Overlap isn't always obvious. A CRM with built-in email sequences, a marketing automation platform, and a standalone customer outreach tool can all be doing the same job for different teams.
Usage and adoption rates
A tool nobody logs into is a tool you're paying for nothing. Usage data - active users, login frequency, feature adoption - tells you whether a tool is embedded in daily workflows or just sitting on a contract.
Low adoption is often the first sign a tool should be cut or replaced.
Cost and ROI analysis
Map every tool's annual cost against its actual contribution. Martech ROI is hard to measure precisely, but you can ask: does this tool directly support a revenue-generating or efficiency-driving workflow?
If the answer is no - or "we're not sure" - that's a red flag.
This step also surfaces which tools are up for renewal soon, giving you negotiating leverage.
How to run a martech stack audit (step-by-step)
Step 1 - Build your tool inventory
Pull data from three sources: your finance or procurement team (invoices, contracts), your IT department (SSO logins, software licenses), and direct surveys of team leads.
Don't rely on memory. Tools get bought, forgotten, and auto-renewed constantly. A common pitfall is treating this as a one-person job - one person rarely has visibility across finance, IT, and every department's day-to-day tooling. Assign a point of contact in each area and give them a simple template to fill in: tool name, vendor, monthly or annual cost, contract end date, and the name of the person who owns it.
Shadow IT is a bigger problem than most teams expect. Individual contributors and team leads regularly sign up for tools on a credit card, get value from them, and never tell procurement. These tools don't show up in IT's SSO logs if they use a separate login, and they don't show up in finance if they're expensed rather than invoiced. Ask team leads directly: "What tools do you use that you pay for yourself or that aren't on the official approved list?" You'll almost always surface something.
For each tool, capture at minimum: vendor name, primary use case, annual cost, contract renewal date, and the named owner - the person accountable for the tool's performance and renewal decision. If you can't identify an owner, that's a red flag in itself. Ownerless tools are the ones that auto-renew for years without anyone checking whether they're still needed.
Once you have a raw list, deduplicate it. The same tool sometimes appears under different names across finance and IT records - a vendor rebrand, a parent company name on the invoice, or a team using a nickname. Resolve those before moving to the next step.
Step 2 - Map categories and functions
Group every tool by what it does: CRM, email, analytics, SEO, paid media, content, data enrichment, project management, etc. Use the chiefmartec.com category taxonomy as a reference - it covers 49 categories.
This mapping is the foundation of your martech stack analysis. You can't spot overlap until you see tools side by side in the same category.
The practical challenge here is that many tools don't fit neatly into one category. A marketing automation platform does email, but it also does landing pages, lead scoring, and CRM-lite contact management. A CRM does contact management, but it may also do email sequences, reporting, and pipeline analytics. Assign each tool a primary category and then list its secondary capabilities separately. The primary category tells you where it lives; the secondary capabilities are where overlap hides.
A common mistake is categorizing tools by what you bought them for rather than what they can actually do. If your CRM has a built-in email campaign feature that nobody uses, it still counts as an email capability - because it means you're paying for that feature whether you use it or not, and it's a potential consolidation point. Be honest about what each tool is capable of, not just how your team currently uses it.
Use a shared spreadsheet or a dedicated tool for this mapping - not a document, not a slide deck. You need to be able to sort and filter by category quickly. Columns should include: tool name, primary category, secondary capabilities, and the team or department that uses it. That last column matters because overlap is often cross-departmental: marketing uses one analytics tool, sales uses another, and neither team knows the other exists.
If your stack is large (30+ tools), prioritize the highest-cost categories first. Overlap in a category where you're spending $250,000 a year is worth more attention than overlap in a category where you're spending $7,000.
Step 3 - Identify overlapping capabilities
Within each category, list what each tool can do - not just its primary use case, but every feature. Then compare. A marketing tech stack audit often reveals that 30–40% of tools share at least one major capability with another tool in the stack.
Flag every overlap. Some are intentional (redundancy for reliability). Most aren't.
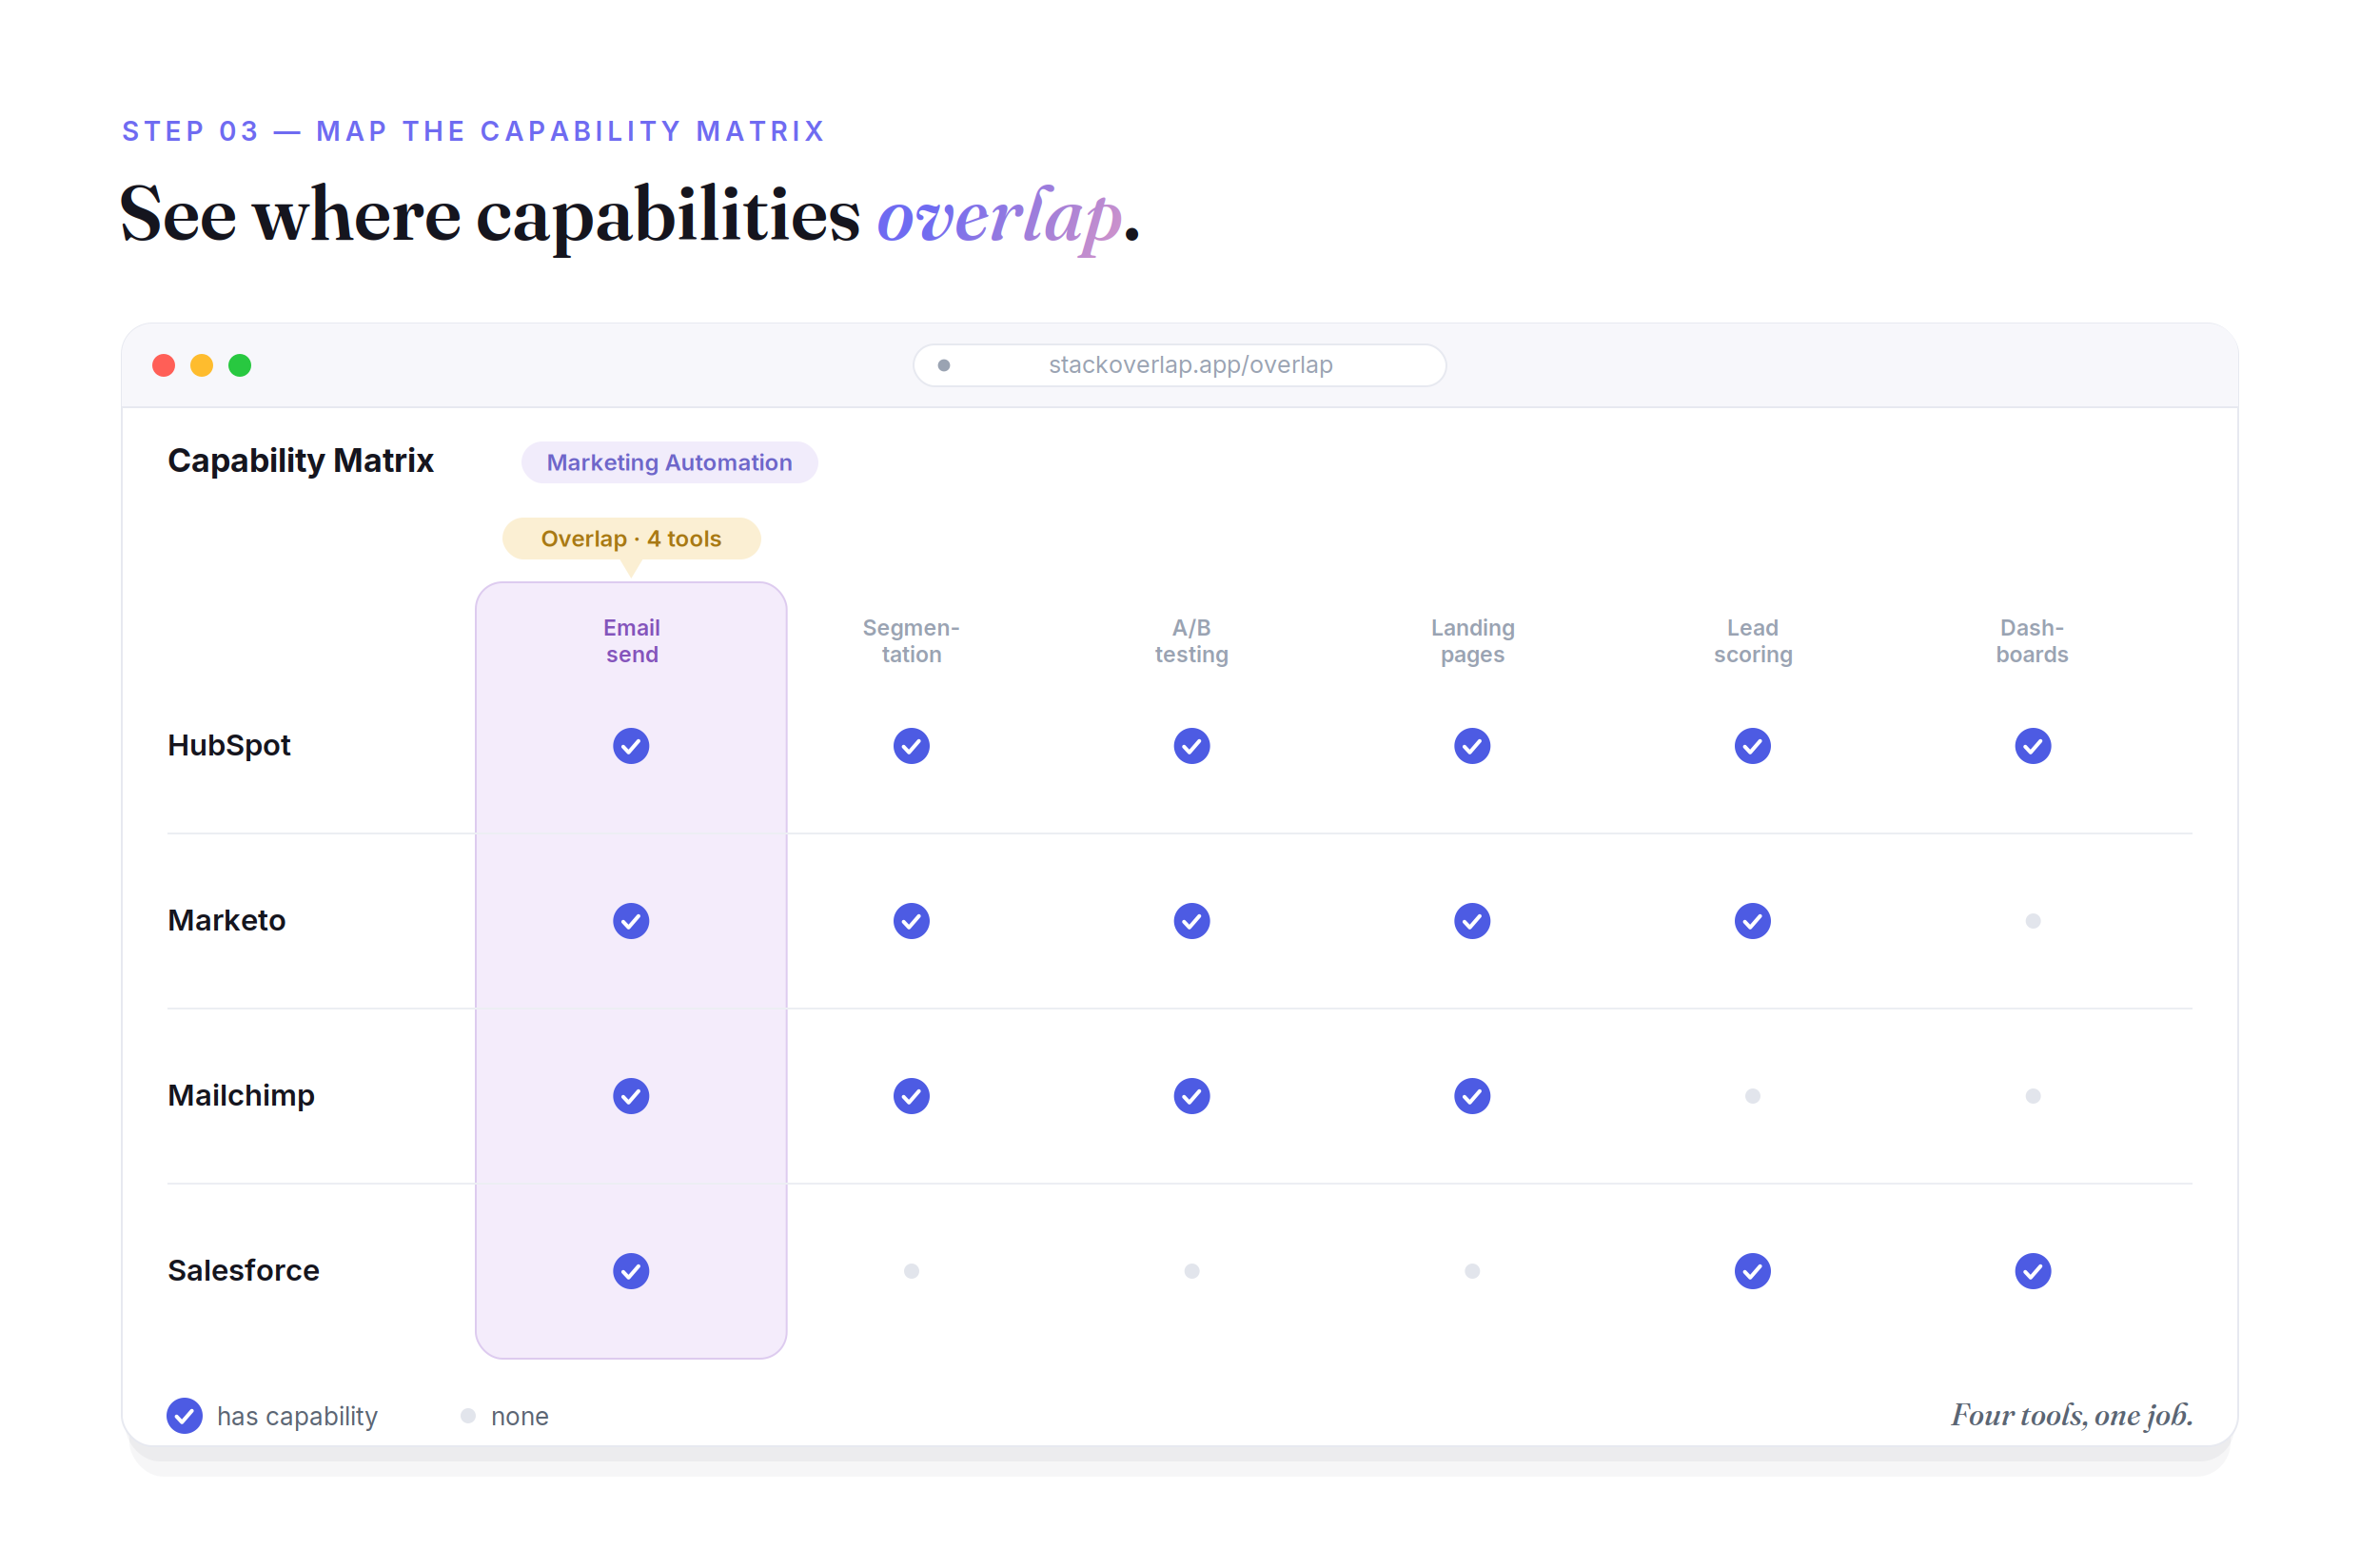
To do this rigorously, build a capability matrix: rows are tools, columns are capabilities (e.g. email send, contact segmentation, A/B testing, reporting dashboards, API access, form builder). Mark which tools have each capability. When two or more tools share a column, that's an overlap. This format makes it impossible to miss duplication that would be easy to overlook when reviewing tools one at a time.
Pay particular attention to platform creep - the pattern where a major platform (Salesforce, HubSpot, Adobe) has expanded its feature set over time to cover capabilities you're also buying from point solutions. Your HubSpot subscription may already include a meeting scheduler, a live chat widget, and a basic reporting tool - but you're also paying for Calendly, Intercom, and a standalone BI tool. The platform capability is often "good enough" to replace the point solution, but nobody has done the comparison.
When you find an overlap, classify it.
Intentional redundancy - where two tools serve the same function for reliability or compliance reasons - is rare and should be explicitly documented and justified.
Accidental redundancy - where teams independently bought tools that do the same thing - is the norm and is almost always worth addressing.
Partial overlap - where tools share one or two features but have meaningfully different primary functions - needs a judgment call: is the shared feature significant enough to matter, or is it incidental?
Don't let perfect be the enemy of good here. You don't need a complete feature-by-feature breakdown of every tool in the stack. Focus on the major functional overlaps - the ones where two tools are both being actively used for the same core job. Those are the consolidation opportunities with real budget impact.
If you want to know where to look first, StackOverlap's audit data across 294+ real stacks shows that waste concentrates most heavily in Marketing Automation (~$36K average annual licensing waste),~ ~Customer Data Platform~ ~(~$34K), and CRM (~$29K).
These three categories alone account for a disproportionate share of total overlap spend. Start your capability matrix there.
Step 4 - Calculate wasted spend
For each overlapping or underused tool, calculate its annual cost. Add them up. This is your "waste number" - the amount you're spending on capabilities you already have elsewhere or aren't using at all.
This figure is what gets CFO attention and unlocks budget for consolidation.
Be precise about what you're counting. Wasted spend has two components: the cost of tools with overlapping capabilities (where you're paying twice for the same function) and the cost of tools with low or zero adoption (where you're paying for something nobody uses). Both belong in the waste number, but keep them in separate columns - they lead to different decisions. Overlap waste is resolved by consolidation; adoption waste is resolved by cancellation or retraining.
For seat-based pricing, don't just look at the contract value - look at how many seats are actually active. A tool licensed for 50 users but used by 12 is wasting 76% of its cost. Most vendors will let you right-size a contract at renewal, so flagging this now gives you a negotiating position even if you're not ready to cancel.
For usage-based or consumption pricing, pull the actual usage data from the vendor dashboard or your finance team's invoices. Compare it against what the tool was projected to be used for when it was purchased. A significant gap between projected and actual usage is a strong signal that the tool isn't embedded in workflows the way it was intended to be.
A common mistake at this stage is underestimating indirect costs. The direct cost is the subscription fee. But there are also indirect costs: the time your team spends managing and maintaining a tool that duplicates something else, the cognitive overhead of switching between redundant platforms, and the data quality problems that arise when the same information lives in two systems that don't stay in sync. These are harder to quantify, but they're real - and mentioning them alongside the hard numbers strengthens the case for consolidation.
Once you have the waste number, present it in annual terms and break it down by category.
"We're spending $247,000 a year on overlapping analytics tools" lands harder than a line item buried in a spreadsheet. This is the number that drives the conversation with leadership and creates urgency around acting on the audit's findings.
To put your waste number in context, StackOverlap's transparency data shows average annual licensing waste of $48K for companies with 1–50 employees, rising to $94K for 51–100 employees, $232K for 101–500, $396K for 501–1,000, and a staggering $748K for organisations with 1,000+ employees.
If your number is significantly above the benchmark for your size, that's a strong signal the stack has grown without governance. If it's below, you definitely still have consolidation opportunities - but you have a credible baseline to work from.
Step 5 - Estimate switching costs
Wasted spend is only half the picture. Before you cut or consolidate, calculate what it will actually cost to make the change.
Data migration is the most underestimated factor. Moving contacts, campaign history, attribution data, or content assets from one platform to another takes time and carries risk. Some data won't map cleanly. Some will need manual cleanup. Estimate the hours required and assign a realistic cost to that work.
Integration complexity matters just as much. Every tool in your stack connects to something else - your CRM feeds your email platform, your analytics tool pulls from your ad accounts, your data warehouse syncs with your BI layer. Replacing one tool can break several integrations. Audit the connections each flagged tool has before deciding to remove it. Rebuilding integrations has a cost in engineering time, and sometimes in third-party connector fees.
Once you have both numbers, weigh them against the waste figure from Step 4. If a tool costs $6,000 a year and migration plus integration work costs $15,000, the payback period is over two years - that changes the decision. If the same migration costs $1,500, it's a straightforward cut. Some consolidations will pay back in months. Others won't be worth it until a contract renewal creates a natural forcing function.
The output of this step is a simple cost-benefit comparison for each flagged tool: annual waste saved versus one-time switching cost. That comparison is what turns a list of overlap findings into a prioritized, defensible consolidation plan.
Step 6 - Consolidate and decide
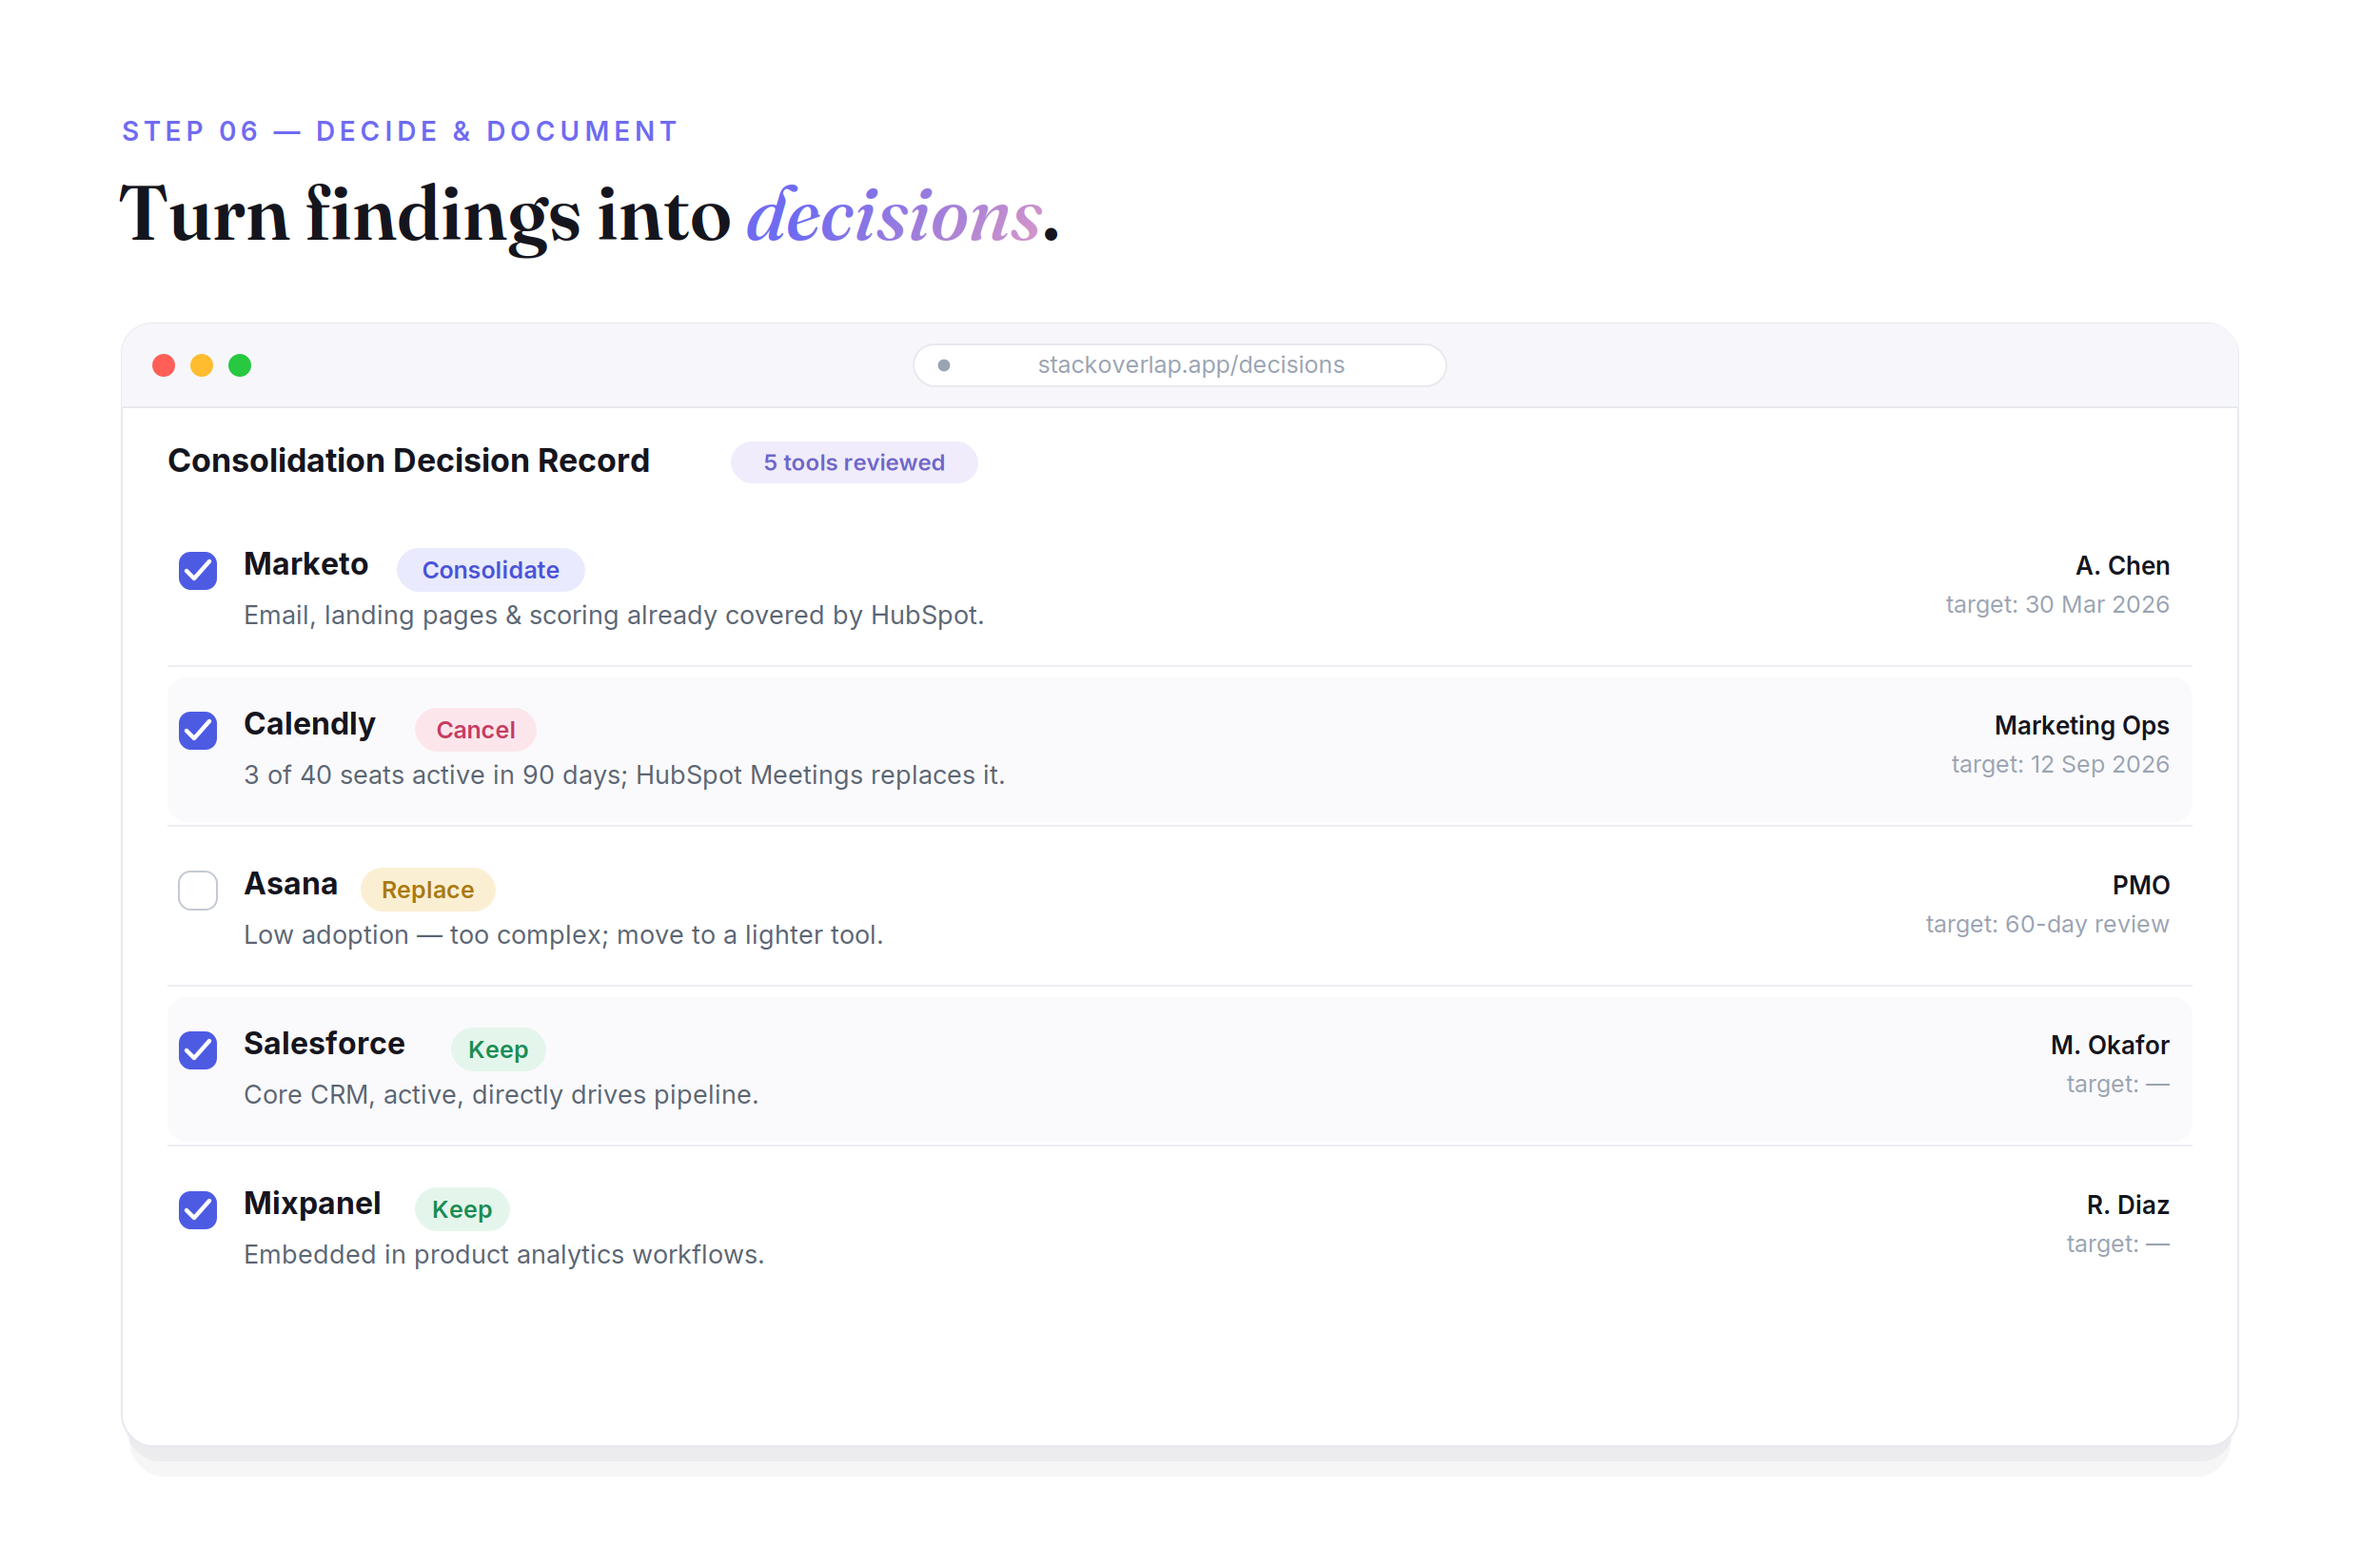
For each flagged tool, make a decision: keep, consolidate, replace, or cancel.
Keep means the tool is earning its place - it has clear ownership, active usage, no meaningful overlap with anything else in the stack, and a defensible ROI. Don't touch it. The goal of an audit isn't to cut everything; it's to cut the right things. A tool that costs $20,000 a year and directly drives pipeline is a keep even if it's expensive.
Consolidate means two or more tools are doing the same job and you're migrating to one of them. The trigger is meaningful capability overlap combined with a switching cost that pays back within a reasonable window (typically 12–18 months, based on your Step 5 analysis). Example: your marketing automation platform already includes a landing page builder, but you're also paying separately for a standalone landing page tool. Consolidate onto the platform you're already paying for and cancel the point solution.
Replace means the tool in its current form isn't the right one, but the function it serves is still needed. The trigger is low adoption driven by poor fit - teams aren't using it because it's clunky, not because the use case has gone away. Example: your team has largely abandoned a project management tool in favour of ad-hoc Slack threads because the tool is too complex. Replace it with something lighter, not nothing.
Cancel means the function itself is no longer needed, or the tool has zero active users and no credible plan to change that. The trigger is a combination of low adoption and no clear business function that would be lost if the tool disappeared tomorrow. Example: a social listening tool bought for a campaign two years ago that nobody has logged into since. Cancel it at the next renewal - or immediately if the contract allows.
Getting stakeholder buy-in is where most audits stall. Team leads get attached to tools, especially ones they championed or personally selected. The way to move the conversation forward is to lead with data, not opinion. Use the waste number from Step 4 and the payback period from Step 5. "We're spending $18,000 a year on a tool that 3 of the 40 licensed users have logged into in the last 90 days, and the function it serves is already covered by our CRM" is a hard argument to push back on. Opinion is debatable; utilisation data and contract costs are not.
Frame the conversation around the team's interests, not the audit's conclusions. A team lead who fought to get a tool approved doesn't want to hear "this was a bad decision." They do want to hear "here's how we free up $18,000 that could go toward something your team actually needs." Switching cost data helps here too - if you can show that migration is a two-week project rather than a six-month ordeal, resistance drops significantly.
For tools where there's genuine disagreement, set a time-boxed review period rather than leaving the decision open-ended. "Let's revisit usage in 60 days" with a specific adoption target gives the tool a fair chance and gives you a clear exit ramp if nothing changes.
Not everything can be cut at once, so sequence matters. Prioritise consolidations in this order: first, tools with the shortest payback period (highest waste, lowest switching cost); second, tools coming up for renewal in the next 90 days, where you have natural leverage to cancel or renegotiate without penalty; third, tools with low team dependency, where migration disruption is minimal. Leave high-dependency, long-payback consolidations for later - forcing a painful migration on a critical tool while simultaneously cutting three others is a good way to lose organisational trust in the whole process.
Contract renewal dates are your most powerful forcing function. A tool that auto-renews in six weeks needs a decision now. A tool that renews in eleven months can be planned properly. Build a renewal calendar as part of this step and work backwards from each date to set a decision deadline.
Document every decision in a consolidation decision record. This is a simple log - one row per tool - with five fields: tool name, decision (keep / consolidate / replace / cancel), rationale (one or two sentences), named owner, and target completion date. It doesn't need to be elaborate. A shared spreadsheet works fine.
The record serves two purposes. First, it keeps the process accountable - decisions with a named owner and a deadline get executed; decisions made verbally in a meeting get quietly reversed. Second, it prevents the common pattern where a consolidation is agreed in principle, nothing is formally documented, and six months later the tool is still running because nobody was explicitly responsible for switching it off.
Share the decision record with all relevant stakeholders after the audit. Visibility creates accountability. When everyone can see that the decision to cancel a tool was made, documented, and assigned, it's much harder for that decision to be walked back informally.
The most common reason teams delay cutting tools is the "we might need it later" objection. It sounds reasonable, but it almost never holds up under scrutiny. Ask two questions: what specific use case would require this tool in the future that isn't already covered by something else in the stack? And what is the probability of that use case arising in the next 12 months? If the answer to the first question is vague and the answer to the second is low, the objection is anxiety, not analysis.
The practical counter is to point out that most cancelled tools can be re-subscribed to within days if a genuine need emerges. SaaS tools are not scarce resources. The cost of re-subscribing to a $500/month tool if you turn out to need it is trivial compared to the cost of paying for it for 12 months on the off-chance you might. If the team is genuinely uncertain, offer a 30-day wind-down period where the tool stays active but no new work is started in it - that's usually enough time to confirm whether the concern is real or hypothetical.
Run your martech stack audit with StackOverlap
Doing this manually takes weeks. Spreadsheets get messy, ownership is unclear, and overlap is easy to miss when you're looking at tools one at a time.
StackOverlap is an AI-powered martech stack analysis tool built specifically for this problem. It runs the full audit automatically - tool inventory, category mapping, overlap detection, and cost analysis - in minutes, not months.
Here's what you get:
- A complete tool inventory with ownership, cost, and renewal data in one view
- Overlap detection across 49 categories, flagging tools that duplicate capabilities
- A wasted spend estimate so you know exactly what consolidation is worth
- Consolidation recommendations ranked by potential savings
- Uniquely tailored advice in advance of vendor renewal conversations
It's built for marketing operations teams who need to move fast and show results - not consultants billing by the hour.
Want to see what the output looks like before you start? View the live example audit at stackoverlap.app/exampleaudit - a real audit output you can explore right now.
Want to see the aggregate results from every audit we've run? View the StackOverlap Transparency Report at stackoverlap.app/transparency - real data from 294+ audits, updated continuously.
How often should you audit your martech stack?
A survey of marketing operations professionals found 50% audit their martech stack quarterly, and 35% audit annually. The right cadence depends on how fast your stack changes.
A practical framework:
- Monthly - Quick check on usage, renewals coming up, and access management. Takes an hour if your inventory is current.
- Quarterly - Full operational review: adoption rates, overlap, ROI, and any new tools added since the last audit. This is the most common cadence for a reason.
- Annually - Strategic rationalization. Reassess the whole stack against business goals, plan consolidation, and set the roadmap for the next 12 months.
- At every contract renewal - Always review a tool before auto-renewing. Renewal is your best leverage point for negotiation or cancellation.
If your stack is small and stable, twice a year is fine. If you're adding tools frequently or running a large team, quarterly is the minimum.
Frequently asked questions
What does a martech stack audit cost?
If you do it internally, the cost is staff time - typically 20–80 hours depending on stack size and how scattered your documentation is. Outsourcing to a consultant runs $5,000–$25,000+ for a mid-size stack. Using a tool like StackOverlap brings that cost down dramatically by automating the inventory and analysis work.
How long does a martech stack audit take?
Manually, expect 2–6 weeks for a stack of 20+ tools - mostly spent chasing down owners and pulling contract data. With an automated tool, the analysis itself takes minutes; stakeholder review and decision-making add a few days.
What's the difference between a martech audit and a martech review?
An audit is a formal, structured process: full inventory, documented findings, cost analysis, and actionable decisions. A review is typically lighter - a periodic check-in on performance and usage without the full documentation layer. Audits happen less frequently; reviews can be ongoing.
How do I know if I have tool overlap in my stack?
A few signals: multiple tools in the same category (two email platforms, three analytics tools), team leads who don't know what tools other departments use, or tools with low adoption despite active subscriptions. The clearest way to find out is to map every tool by function and compare capabilities side by side - which is exactly what a martech stack audit does.
Useful sources
- chiefmartec.com - 2026 Marketing Technology Landscape Supergraphic: Peak Martech Achieved! (Maybe)
- marketingops.com - Marketing Tech Stack Audit Guide for Marketing Operations
- smartinsights.com - How to audit your martech stack
- ascend2.com - The Future of the MarTech Stack 2025 (PDF)
- martech.org - Why martech stacks are getting messier